
Retail shrink analysis is the systematic measurement of inventory loss by cause, location and item so a business can act on the biggest problem first. The immediate priority is precise measurement: track loss at item, store and incident level, segment by offender and category, then direct resources at the pockets doing the most damage. Done properly, this identifies high-impact areas within weeks and feeds a 90-day plan.
TL;DR:
- Most retail shrink results from a small group of repeat offenders responsible for a disproportionate share of loss, making targeted investigations more effective.
- Using consistent metrics like shrink percentage on cost basis and tracking by category and SKU is essential for accurately identifying high-impact loss areas.
- A phased 90-day plan focusing on data clean-up, targeted interventions, and staff engagement helps build a sustainable shrink reduction program.
- Privacy concerns, especially around facial recognition, require thorough assessments and human verification before any implementation.
- Effective shrink management depends on clear ownership, regular review cadences, and integrating data insights into daily inventory and loss prevention strategies.
Table of Contents
- What counts as shrink: types, scope and classification
- Causes and data: scale, trends and what national evidence shows
- Metrics and calculations: KPIs, formulas and worked examples
- Shrink governance and the KPI dashboard: roles, fields and review cadence
- Implementation roadmap and a 90-day shrink action plan template
- Analytics, tools and privacy guardrails: methods and technology limits
- Best practices for conducting root cause analysis of shrink incidents
- Integrating shrink analysis with loss prevention and inventory management strategies
- Methods to quantify financial impact of different shrink types for prioritisation
- Approaches to employee training and engagement to reduce internal theft
- Benchmarking shrink metrics against industry standards
- What experience on the ground adds to shrink data
- ABCO Security: practical support for measuring and reducing shrink
- Sources
- FAQ
What counts as shrink: types, scope and classification
Shrink is any gap between the inventory a business should have, based on records, and what it actually has on hand. Lumping every dollar of that gap into one number hides the story, because each cause needs a different response.
- External theft: customer theft, organised retail crime and burglary, usually tackled through deterrence, surveillance and physical security.
- Internal theft: employee theft, collusion with external parties, or misuse of discounts and returns, which calls for access controls and audit trails.
- Administrative error: pricing mistakes, receiving errors and miscounts, fixed through process discipline rather than policing.
- Vendor fraud: short deliveries, invoice manipulation or mislabelled cartons, caught through receiving reconciliation.
- Damage and spoilage: breakage, expiry and handling loss, addressed through storage and stock rotation practices.
Classification changes the tactic. Chasing a spoilage problem with more CCTV wastes budget, and treating an administrative error as theft can damage staff trust for nothing. This is also where the denominator effect matters: a store with high sales can post a low shrink percentage while carrying a large absolute dollar loss, because the percentage is diluted by revenue. Reporting shrink as a single blended figure, without its category breakdown, routinely sends loss-prevention teams after the wrong problem.
Causes and data: scale, trends and what national evidence shows
Retail crime has become a disproportionate share of theft overall. Nationally, a significant portion of recorded theft incidents occurred in retail settings in 2024, with a large number of retail incidents recorded against 595,660 total theft victims across all settings. Weapon-related retail incidents also rose sharply over the same period.
A small group of offenders drives most of the loss. Industry reporting indicates a small group of offenders are responsible for a large share of total harm and loss, a concentration that should reshape how loss-prevention teams allocate investigative time.
That concentration has direct operational implications:
- Case-level logging (not just aggregate shrink totals) is needed to spot repeat individuals and linked incidents across stores.
- Intelligence sharing between stores, and with law enforcement, closes cases faster than any single site working alone.
- Prioritising the top-offender segment, rather than spreading effort evenly across all incidents, tends to produce outsized reductions for the same investigative hours.
- Escalating violence in a subset of incidents means safety protocols and shrink-reduction tactics now have to be designed together, not separately.
None of this means every retailer faces organised crime at scale, but it does mean a shrink programme that only counts dollars, without tagging repeat offenders and incident type, will miss the pattern that matters most.
Metrics and calculations: KPIs, formulas and worked examples
Consistent formulas are what make shrink numbers comparable across stores, periods and categories. The core set every team should track:
- Shrink % (sales basis): (booked inventory value at retail, minus actual inventory value at retail) divided by net sales, expressed as a percentage.
- Shrink % (cost basis): the same gap calculated at cost rather than retail price, which strips out margin distortion and is preferred for cross-category comparison.
- Shrink per store: total shrink dollars divided by store count or by store trading area, used to rank locations.
- Shrink per SKU or category: shrink dollars attributed to a specific product line, which surfaces which items are disappearing fastest.
- Detection rate: incidents identified and logged as a proportion of estimated total incidents (often modelled, since not every loss event is observed).
- Recovery rate: value recovered through apprehension, insurance or restitution as a proportion of total loss value.
- Cost per incident: total investigation and resolution cost divided by number of confirmed incidents, useful for judging whether a control is worth its overhead.
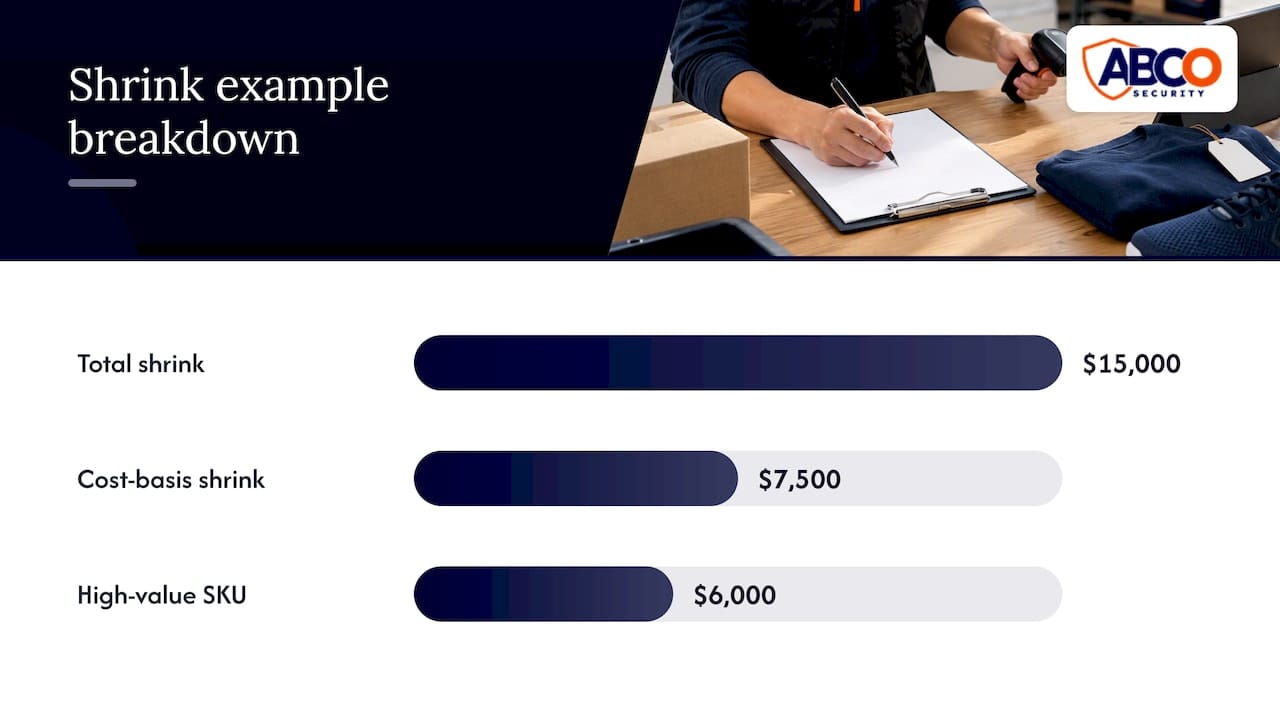
A worked example: say a store’s booked inventory at retail value is $500,000 and a stocktake finds $485,000 on hand, against net sales of $2,000,000 for the period. If that same $15,000 gap is reworked at cost (assume a 50% margin, so cost value is $7,500), shrink as a percentage of cost of goods sold will read differently again, which is why the basis used must always be stated alongside the figure. Slicing that $15,000 by category might show that a single high-value SKU accounts for $6,000 of it, a pattern invisible in the store-level number alone.
Pro Tip: Report shrink monthly at category level and quarterly at SKU level. Monthly SKU-level reporting usually generates noise rather than insight, because sample sizes per item are too small to separate a real trend from normal variance.
Shrink governance and the KPI dashboard: roles, fields and review cadence
A shrink number without an owner rarely changes. Governance means naming who is accountable for each metric and setting a cadence for review before the first dashboard is even built.
- An executive sponsor sets the shrink target and approves budget for interventions.
- A loss-prevention lead owns case investigation, offender tracking and escalation decisions.
- Operations owns store-level execution: stocktake discipline, staff rostering around high-risk periods, and receiving accuracy.
- Finance owns the shrink-to-revenue reconciliation and validates the cost basis used in reporting.
- Legal or communications signs off on any customer-facing surveillance technology and on public statements about incidents.
Weekly reviews suit high-risk stores and active investigations; monthly reviews suit category and portfolio-level trend tracking.
The dashboard itself needs dimensions granular enough to support the case-level analysis discussed above, not just a topline percentage.
| Dashboard field | Purpose |
|---|---|
| Store and region | Ranks locations by shrink rate and absolute dollar loss |
| SKU and category | Identifies which products are driving loss |
| Incident type | Separates theft, error, damage and fraud for targeted response |
| Date and time band | Flags high-risk shifts and seasonal spikes |
| CCTV clip reference | Links footage to a specific logged incident for investigation |
| Staff on duty | Supports internal-theft pattern analysis when cross-referenced with rosters |
Thresholds should trigger action, not just colour on a chart: a store exceeding its category-adjusted shrink target for two consecutive periods should automatically escalate to the loss-prevention lead, and a single high-value incident above a set dollar threshold should trigger same-week case review rather than waiting for the monthly cycle.
Implementation roadmap and a 90-day shrink action plan template
A shrink programme succeeds or fails on sequencing. Trying to fix everything in week one produces noisy data and burnt-out staff; a phased approach gets a usable baseline first, then targets, then scales what works.
- Weeks 1 to 3, baseline and data clean-up: reconcile POS and inventory system records, standardise incident categories across stores, and run a full stocktake in a representative sample of locations.
- Weeks 4 to 6, first analysis pass: segment shrink by store, category and incident type, and identify the top 10% of SKUs or offenders driving loss, using the concentration pattern already documented in industry data.
- Weeks 7 to 9, targeted interventions: deploy specific countermeasures to the highest-impact pockets, such as adjusted CCTV coverage, revised stock placement for high-shrink SKUs, or tightened receiving checks for a vendor showing fraud indicators.
- Weeks 10 to 12, staff engagement and quick wins: run short refresher training tied to the specific error patterns found in the data, publicise early wins internally to build buy-in, and formalise the reporting cadence into a standing governance meeting.
- Ongoing from day 90, scale and embed: extend proven interventions to comparable stores, review thresholds quarterly, and fold shrink KPIs into standard operations reporting rather than treating them as a side project.
The most common execution traps are measuring too broadly (a single blended percentage hides the pockets that matter), under-resourcing the analysis role so data collection outpaces review, and running interventions without a communications plan, which can turn a legitimate control into a staff-relations problem.
Analytics, tools and privacy guardrails: methods and technology limits
Once baseline data exists, a handful of analytic techniques do most of the useful work: enriching each incident record with context (time, staff, weather, promotions running), ranking offenders and locations by concentration of loss, running anomaly detection across POS transactions to flag unusual voids or refunds, and building heatmaps that overlay shrink dollars against store layout or trading hours.
Tool categories that support this work generally fall into incident reporting systems, POS transaction analytics, dedicated loss-prevention reporting platforms, and case-management software that links footage, statements and outcomes to a single record. None of these replace the governance layer described earlier; they only make it faster to run.
Facial recognition sits in a different category because of its privacy risk. OAIC guidance published in July 2026 requires a detailed, case-specific privacy risk assessment before any retail use of facial recognition technology, with necessity and proportionality documented in writing, not assumed.
Retailers should assess whether facial recognition is a proportionate response to the risk before deployment, apply privacy-by-design principles, and build in human verification rather than relying on automated matches alone.
Any technology this invasive needs a documented privacy impact assessment and a clear line to legal sign-off before rollout, not after a complaint.
Best practices for conducting root cause analysis of shrink incidents
Root cause analysis only works when it starts from a specific incident record, not a category total. Pull the case-level detail: who was on shift, what the incident type was, what the CCTV clip shows, and whether the SKU involved has appeared in prior incidents at the same or other stores.
Ask what allowed the loss to occur rather than only who caused it. A high-value SKU repeatedly appearing in shrink reports might point to a display placement problem as much as a theft problem, and an administrative error spiking at one store might trace back to a training gap rather than any dishonesty.
Cross-reference incidents against rosters, delivery schedules and promotional calendars. A shrink spike that lines up neatly with a particular shift pattern or a specific vendor’s delivery window is a stronger lead than a spike with no such correlation.
Close the loop by recording the corrective action taken against each root cause, and revisit closed cases after 60 to 90 days to confirm the fix held. A root cause analysis process that never checks its own outcomes tends to keep solving the same problem repeatedly, under a new incident number each time.
Integrating shrink analysis with loss prevention and inventory management strategies
Shrink data is only useful when it changes what loss prevention and inventory teams actually do day to day. That means feeding the shrink dashboard’s category and SKU findings directly into stock placement decisions, reorder points and cycle-count schedules, rather than keeping shrink reporting as a separate exercise that operations reviews after the fact.
A high-shrink SKU identified through the dashboard should trigger a review of its shelf location, security tagging and count frequency, not just a note in a monthly report. Similarly, a store flagged for elevated internal-theft indicators should see its access control and till-reconciliation processes tightened before the next stocktake, not after the next annual audit.
The reverse link matters too: inventory management systems generate the receiving, count and adjustment data that shrink analysis depends on. Poor cycle-count discipline produces false positives in shrink reporting, so inventory accuracy work and shrink analysis should sit under shared review rather than separate teams reporting up different chains. A practical primer on inventory tracking methods is a useful reference for teams building this link for the first time.
Methods to quantify financial impact of different shrink types for prioritisation
Not every dollar of shrink deserves the same response, so ranking causes by financial impact, not just incident count, is what makes a shrink programme efficient rather than reactive.
Start by attaching a dollar value to each shrink category from the classification work done earlier: external theft, internal theft, administrative error, vendor fraud and damage. Multiply average loss per incident by incident frequency for each category to get a total exposure figure, then weight that against the cost of a plausible intervention, since a category with high total exposure but a cheap fix should usually be tackled before a smaller category needing an expensive one.
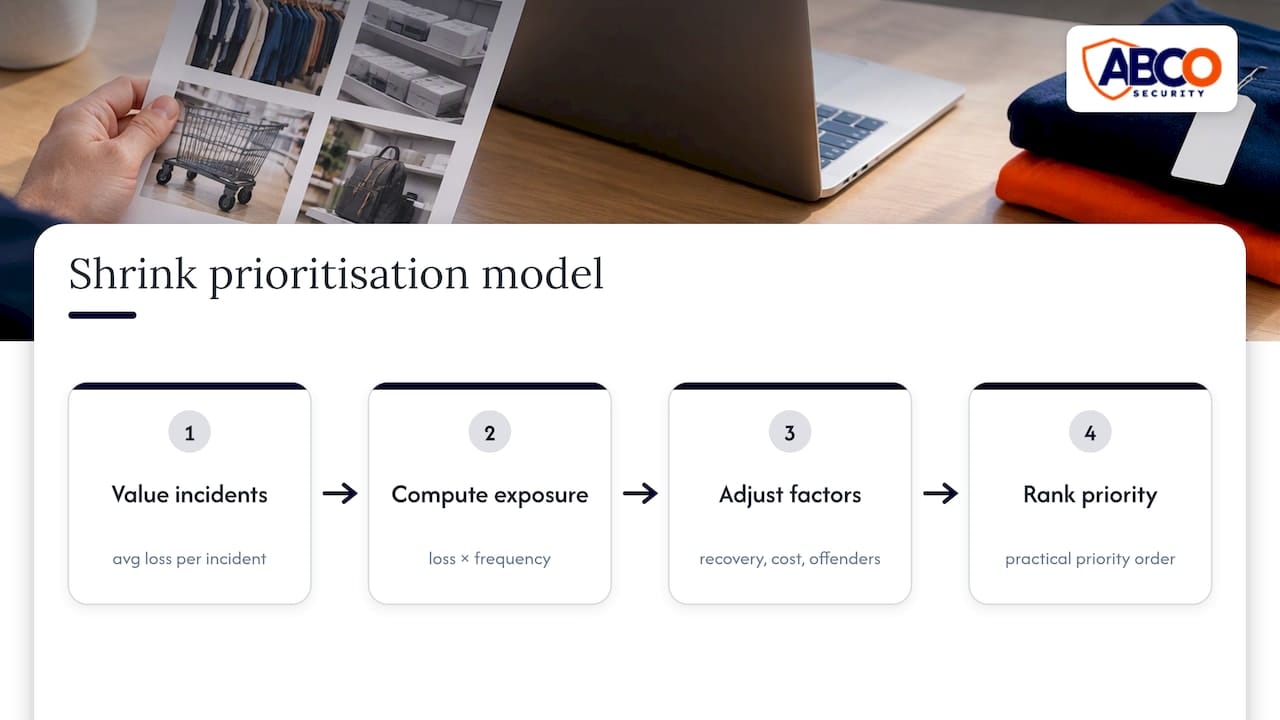
Factor in recovery rate as well. A category with a low recovery rate, such as unrecovered external theft, represents a harder dollar loss than a category like vendor short-delivery, where credit notes or reconciliation can often recover much of the value after the fact.
This is also where the offender-concentration pattern from Australian retail crime reporting earns its place in the prioritisation model: if a small group of repeat offenders accounts for a disproportionate share of external theft loss, that single category can jump to the top of the priority list even if its incident count looks modest next to administrative error.
Approaches to employee training and engagement to reduce internal theft
Internal theft responds differently to intervention than external theft, because the deterrent effect of process visibility often works better than surveillance alone. Staff who know that till discrepancies, void patterns and stock counts are actively reviewed behave differently from staff who believe no one is watching the numbers.
Training should be specific rather than generic. A session built around the actual error and incident patterns found in a store’s own shrink data lands better than a standard induction module repeated annually, because staff can see the connection between the training content and what is being measured about their own workplace.
Engagement matters as much as training content. Sharing de-identified shrink trends with store teams, and recognising stores that improve their numbers, builds a culture where reducing shrink is a shared goal rather than something loss prevention does to staff. Clear, consistently enforced policies on discounts, returns and till access reduce the ambiguity that lets small dishonesty escalate unchecked.
Pairing engagement with proportionate access controls, such as segregated duties for high-risk transactions and regular unannounced till audits, closes the gap between awareness and actual behaviour change.
Benchmarking shrink metrics against industry standards
Benchmarking only works when the comparison basis is stated clearly, because shrink percentages calculated on different bases are not directly comparable. The ANZ retail crime study reported an average crime-related loss of 0.88% of revenue for the 2021 to 2022 period, with external theft making up around 56% of that shrink figure, the largest single category.
Treat that figure as a reference point for crime-related loss specifically, not a target that covers all shrink causes, since administrative error, vendor fraud and damage sit outside that particular measure. A retailer benchmarking its own total shrink number against a crime-only industry figure will draw the wrong conclusion in either direction.
Benchmark by category where possible, comparing external theft rates against external theft rates and administrative error against administrative error, rather than comparing blended totals across businesses with different product mixes and store formats. A grocery retailer and an apparel retailer carry very different damage and spoilage profiles, which makes a blended cross-sector comparison close to meaningless.
Use benchmarking to flag where a category looks materially out of line with the reference point, then apply the root cause and financial-impact methods above to confirm whether that gap is real or an artefact of measurement basis.
What experience on the ground adds to shrink data
Numbers on a dashboard only tell part of the story. ABCO Security combines licensed guards, mobile patrols and monitored CCTV with more than 15 years in the security industry, working to ISO 9001 and ISO 30000 standards, which means the incident data feeding a shrink analysis programme is captured consistently from the point of occurrence, not reconstructed after the fact.
— Abco
ABCO Security: practical support for measuring and reducing shrink
Retailers running a shrink programme need reliable capture at the source: monitored CCTV, guards who log incidents consistently, and patrols that deter repeat offenders identified through your analysis. 
ABCO Security delivers A1 CCTV & Alarm Monitoring, Mobile Patrol Services and licensed Security Guarding built around your shrink data, with the Night Owl Service available from $5.45 per day for after-hours coverage. Retailers with elevated external-theft rates or multi-site loss patterns tend to benefit most. Get in touch to scope an initial assessment against your own shrink dashboard.
Sources
- Retail crime surge commentary — Monash Lens
- Privacy Commissioner publishes updated guidance on facial recognition in retail spaces — OAIC
- The 2022 Australia and New Zealand retail crime study — National Retailers Association
FAQ
What is a good shrink percentage in retail?
There is no single universal target, because acceptable shrink varies by sector and product mix. The ANZ retail crime study reported an average crime-related loss of 0.88% of revenue, which is a useful reference point for that category specifically, not for total shrink including error and damage.
How is shrink calculated in retail?
Shrink is the gap between booked inventory value and actual inventory found on hand, expressed as a percentage of either sales or cost of goods sold. The basis used (sales or cost) should always be stated alongside the figure, since the same dollar gap produces different percentages depending on which denominator is applied.
What are the five KPIs in retail loss prevention?
Common KPIs tracked in a shrink programme include shrink percentage, shrink per store, shrink per SKU or category, detection rate and recovery rate. Some teams add cost per incident as a sixth measure to judge whether a given control is worth its overhead.
What are the three types of shrink in retail?
Shrink is generally grouped into external theft, internal theft and administrative or operational error, with vendor fraud and damage or spoilage sometimes tracked as separate categories. Classifying each incident correctly matters because each type calls for a different response, from surveillance and access controls to process fixes.
Why do a small number of offenders account for so much retail loss?
Industry reporting on organised retail crime shows that a small group of repeat offenders is responsible for a disproportionate share of total harm and loss. This is why case-level incident logging and intelligence sharing between stores tend to produce faster reductions than spreading resources evenly across all incidents.
Recommended
about
avada factory
Sempery ultricies nibh at dolor cras urna eleifend nec. Atiam efficitur tempor.